A terminal instrument console: watch, poke, fault and share one virtual bench
By Alex Hernandez · · 14 min read
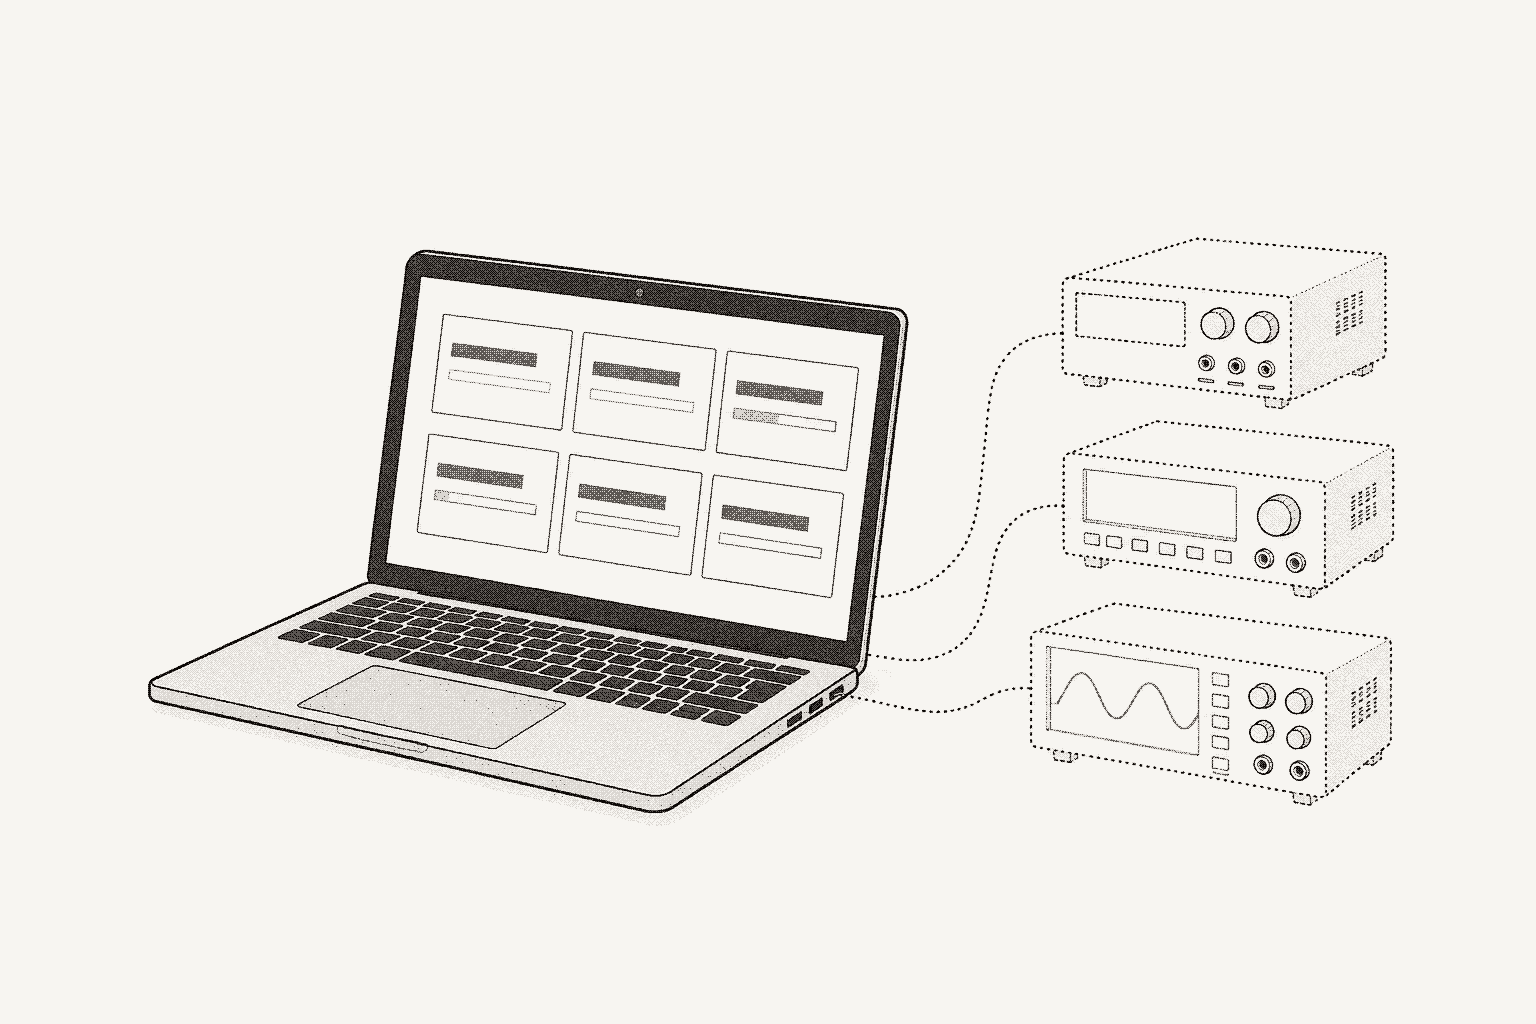
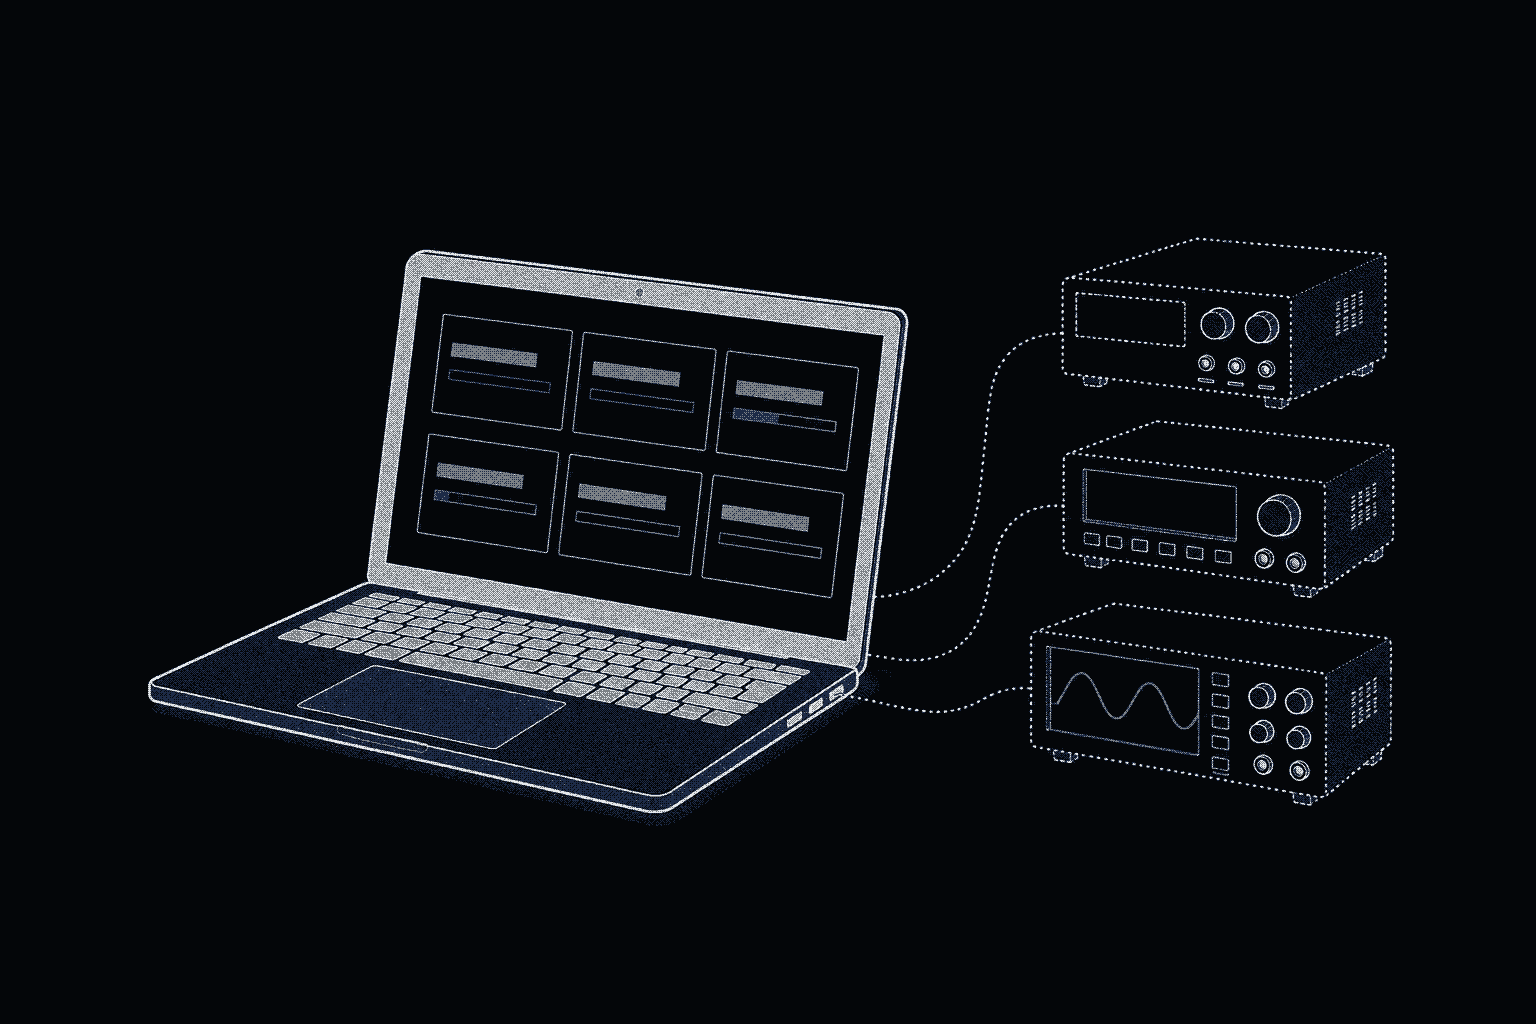
edgesim tui bench.yaml opens a terminal console for a virtual bench: a card per instrument drawn from its profile, the nets between them, a live SCPI log and keys to edit values and inject faults. The clock runs and scopes stream by default. Attach it to a served World and a script, pytest and an agent act on the bench you are watching.
EdgeSim is the open-source bench simulator from Galois Labs: simulated instruments wired into simulated benches that PyVISA scripts, pytest, galois-edge and AI agents can't tell from real hardware. This guide goes bench by bench: find a tripped supply, drive one from the keyboard, plot a filter, break a meter under a retrying client, share a World, script docs screenshots and draw an unseen instrument. Every command and capture ran against EdgeSim 0.2.0 on Python 3.13 with Textual 8.2.8 and PyVISA 1.16.2 unless a block is marked illustrative; live screens are tmux captures, headless ones Textual SVG files read back as text. The three clips replay scripts shown here on the live console, so their clocks run, and headless captures sit at t = 0. The EdgeSim announcement is the wider tour, and the console is one of its doors.
What does the console show for a twelve-instrument bench?
EdgeSim's twelve_instruments.bench.yaml example is a fleet with no wiring: four supplies, three multimeters, two function generators, two scopes and a Keysight DSOX3000 converted from a real profile. One supply is set to trip its overvoltage latch as the bench opens. The first two columns and rows of the 120-by-40 overview, from a headless capture:
┌─ SIM-PSU-1 · POWER SUPPLY ──────────┐ ┌─ SIM-PSU-2 · POWER SUPPLY ──────────┐
│ ID:     GALOIS,SIM-PSU-2,SIM00001   │ │ ID:     GALOIS,SIM-PSU-2,SIM00001   │
│ CH1 CV  ON  5.000 V  0.0000 A       │ │ CH1 OFF  OFF  0.000 V  0.0000 A     │
│ CH2 OFF  OFF  0.000 V  0.0000 A     │ │ CH2 OFF  OFF  0.000 V  0.0000 A     │
│ WIRING: OUT1→— OUT2→—               │ │ WIRING: OUT1→— OUT2→—               │
│ ERRORS: 0                           │ │ ERRORS: 0                           │
└─────────────────────────────────────┘ └─────────────────────────────────────┘
┌─ SIM-PSU-4 · POWER SUPPLY ──────────┐ ┌─ SIM-DMM-1 · DMM ───────────────────┐
│ ID:     GALOIS,SIM-PSU-2,SIM00001   │ │ ID:     GALOIS,SIM-DMM,SIM00001     │
│ CH1 OVP OFF OFF 0.000 V 0.0000 A    │ │ VALUE —  DCV                        │
│ CH2 OFF OFF 0.000 V 0.0000 A        │ │ RANGE 10.00 V  NPLC 10              │
│ WIRING: OUT1→— OUT2→—               │ │ WIRING: INPUT→—                     │
│ ERRORS: 1  324                      │ │ ERRORS: 0                           │
└─────────────────────────────────────┘ └─────────────────────────────────────┘
One card per instrument. ID: is the *IDN? reply, then come a line per channel, the WIRING: ports with the nets they reach (— is no net) and the error-queue depth with its newest code. All twelve cards fit in three columns above a bench-wide SCPI LOG.
State is text. The palette is monochrome: CV, CC, ON and OFF are words, and red marks errors, a lit trip, a non-empty error queue and destructive buttons, so SIM-PSU-4 (OVP in its mode slot, ERRORS: 1 324) is the one red card.
Press 4 and Enter and the card opens as a screen that says why: a 5 V setpoint against a 4 V trip level. A client's SYSTem:ERRor? then pops the queued code, and the card's error count falls to 0:
Key 4 focuses the one red card among twelve, Enter opens SIM-PSU-4 to show a 5.000 V setpoint against a 4.000 V overvoltage level, and an error query returns 324 and drops the error count to 0.
trip.script is the clip's three steps, and its capture ends on the queued code:
@press 4
@press enter
sim-psu-4 SYSTem:ERRor?
@shot trip-cause$ edgesim tui twelve_instruments.bench.yaml --screenshot shots --script trip.script
shots/trip-cause.svg00:00:00.000 SYSTem:ERRor? → 324,"Overvoltage protection tripped"The clip stamps the same line 00:00:04.200, the virtual time at which it was sent.
The channel box has status, voltage and current columns and a row of buttons, which are the controls:
┌─ CHANNEL 1 ───────────────────────────────────────────────────────────
│ STATUS                 VOLTAGE                CURRENT
│ MODE:   OFF            ACTUAL:  0.000 V       ACTUAL:  0.0000 A
│ OUTPUT: OFF            SET:     5.000 V       SET:     0.1000 A
│ TRIP:   OVP            V LIMIT: 30.000 V      I LIMIT: 3.0000 A
│                        OVP:     4.000 V       OCP:     OFF @ 3.3000 A
│
│  OUTPUT      OCP         V SET      OVP         I SET    OCP SET
└───────────────────────────────────────────────────────────────────────
Nothing is written per instrument. The console reads each profile's state: and ports:: floats become readouts with units, booleans toggles, enums selectors, ports net badges, and a command that acquires a waveform gets a plot. Nine class templates bind slots to the capability ids profiles declare; a profile binding fewer than two gets the generic layout, and a test greps the console's source for model names and fails on any. A thermal chamber shows the generic layout; the EdgeSim announcement covers one profile doing three jobs.
How do I open the console and which keys matter?
EdgeSim's open-source release, with the edgesim package and its edgesim[tui] console extra, is coming soon. The console opens a bench file with one command:
edgesim tui twelve_instruments.bench.yamlThe console needs the edgesim[tui] extra, Textual 7.0 or newer; without it the command prints an install hint and exits 2. A bench that fails to load prints every diagnostic as CODE pointer message and exits 1. The flags:
| Flag | What it does |
|---|---|
BENCH | Bench file, opened in this process |
--attach SOCKET | Attach to a served World; excludes BENCH |
--no-serve | Skip the SCPI listeners (one per instrument from port 5025) |
--base-port P, --host H | Move the listeners; port 0 lets the OS pick, and a held port exits 1 |
--clock, --seed, --profile-dir DIR | Override the clock (stepped, scaled or wall), the seed or the profile path |
--fps N | Render ticks a second, 1 to 1000, default 120 |
Interactive, the clock is --clock, else the bench's when it is wall or scaled, else scaled at real time: the console is live unless asked for --clock stepped. --screenshot always runs stepped, and an attached console takes the served World's clock. The keys:
| Screen | Keys |
|---|---|
| Any | n nets, l full SCPI log, a advance a stepped clock 1 s, q quit |
| Overview | Arrows or Tab move between cards, 1 to 9 jump to one, Enter opens it, Space switches its outputs, f fault |
| Instrument | Tab and arrows walk the buttons; Space toggles a switch; Enter or e edits a value; + and - step it; t trees, / searches both, L adds latent variables, f fault, Esc back |
| Scope | r runs or stops the display, m cycles the memory depth |
| Nets | Up and down select, Enter opens the driver, w toggles the waveform |
Scopes stream. On a live clock a scope screen draws what the scope acquires, probe, coupling and bandwidth included. m steps the memory depth through 1k, 10k and 100k points, SINGLE holds one record (the codes :DIGitize and :WAVeform:DATA? return), and the display rolls from 50 ms/div. The header shows the run state before the clock. On a stepped clock the display moves only when a advances time.
How do I poke an instrument and watch the nets?
Press 2 and Enter to open SIM-PSU-2, Tab twice to focus the V SET button, and e for the prompt. It names the variable (output.voltage_setpoint[1]), its current value and its range (0 … 30 V), and refuses what the range refuses. Type 9 and Enter, then press + once. The SCPI LOG records both edits:
00:00:04.723  CONFIGURE output.voltage_setpoint[1] = 9.0
00:00:05.728  CONFIGURE output.voltage_setpoint[1] = 9.2
Every operator action is a World action and is traced like any other step: an edit is a Configure, a fault an InjectFault, the a key an Advance. Configure is an out-of-band state override, not a command, and the console never writes a derived variable. To test the command path itself, send SCPI.
An edit meets the same physics as a command. With the current limit at 5.5 mA on the PSU, 1 kΩ resistor and DMM bench, four presses of + on V SET walk the setpoint from 5.0 V to 5.8 V; at 5.6 V the supply hands over to constant current and holds 5.499 V:
With a 5.5 mA limit into 1 kΩ, each press of + raises the setpoint 0.2 V, and at 5.6 V the supply hands over to constant current and holds 5.499 V while the setpoint climbs to 5.800 V.
The handover is arithmetic: 5.6 V across 1 kΩ would draw 5.6 mA, past the 5.5 mA limit. cv_to_cc.script replays the clip:
@open sim-psu-1
sim-psu-1 :SOURce1:CURRent 0.0055
sim-psu-1 :SOURce1:VOLTage 5
sim-psu-1 :OUTPut1:STATe ON
@press tab tab
@press plus
@press plus
@press plus
@press plus
@shot v-set-5p8$ edgesim tui psu_resistor_dmm.bench.json --screenshot shots --script cv_to_cc.script --size 100x30
shots/v-set-5p8.svgMODE: CC ACTUAL: 5.499 V ACTUAL: 0.0055 A
OUTPUT: ON SET: 5.800 V SET: 0.0055 A
# ... elided
00:00:00.000 CONFIGURE output.voltage_setpoint[1] = 5.2
00:00:00.000 CONFIGURE output.voltage_setpoint[1] = 5.4
00:00:00.000 CONFIGURE output.voltage_setpoint[1] = 5.6
00:00:00.000 CONFIGURE output.voltage_setpoint[1] = 5.8In the clip the edits carry their keypress times, 3.200 to 6.200 s; the headless capture stamps all four 0.000.
Wiring makes a circuit: EdgeSim's awg_rc_scope.bench.yaml example drives an RC low-pass (1 kΩ and 100 nF, so the corner is 1/(2π × 1 kΩ × 100 nF) = 1.592 kHz) from the generator's OUT1 into scope CH1. This script plots net-1, the filter's output, and steps the generator from 1 kHz to 4 kHz:
# the AWG drives an RC low-pass that feeds a scope; plot net-1, the filter output
@press n
@press down
sim-awg-1 :OUTPut1:STATe ON
@shot net1-1000hz
sim-awg-1 :SOURce1:FREQuency 1500
@shot net1-1500hz
sim-awg-1 :SOURce1:FREQuency 2000
@shot net1-2000hz
sim-awg-1 :SOURce1:FREQuency 3000
@shot net1-3000hz
sim-awg-1 :SOURce1:FREQuency 4000
@shot net1-4000hz$ edgesim tui awg_rc_scope.bench.yaml --screenshot shots --script nets.script --size 100x30
shots/net1-1000hz.svg
shots/net1-1500hz.svg
shots/net1-2000hz.svg
shots/net1-3000hz.svg
shots/net1-4000hz.svg208 samples · 2.000 ms window · sine 1.000 kHz 999.9 mVpk → LP 1.592 kHz p-p 1.693 V
208 samples · 1.000 ms window · sine 4.000 kHz 999.9 mVpk → LP 1.592 kHz p-p 739.3 mVOn the live console the filter settles before the plot draws, so net-1's peak-to-peak falls from 1.693 V at 1 kHz to 739.3 mV at 4 kHz, the one-pole response (0.847 and 0.370 of 2 V). A headless capture runs at t = 0, before it settles, and reads 856.3 mV at 4 kHz. The clip glides there, one frequency command per frame:
With the clock running, the generator glides from 1 kHz to 4 kHz at one frequency command per frame, and net-1's peak-to-peak falls from 1.693 V to 739.3 mV past the 1.592 kHz corner.
The generator's 999.9 mV peak never changes, so the fall is the filter's. The plot comes from the net's descriptor, never steps the World and is never traced, because simulated signals are descriptions, not samples.
How do I inject a fault from the console?
Press f on a card or on an instrument screen. The prompt takes kind [name=value ...], where the kind is timeout, disconnect, garble, error, latency, busy, drift or trip: timeout takes count, error takes code, latency takes ms, busy takes duration_s, and drift takes path and rate.
To rehearse retry code, run the console on the twelve-instrument bench, press 5 and f to target SIM-DMM-1, and enter timeout count=1. The meter swallows its next reply once. This client retries once, with a one-second timeout:
import pyvisa

rm = pyvisa.ResourceManager("@py")
dmm = rm.open_resource("TCPIP0::127.0.0.1::5029::SOCKET", read_termination="\n", write_termination="\n")
dmm.timeout = 1000  # ms

for attempt in (1, 2):
    try:
        print(f"attempt {attempt}:", dmm.query("*IDN?"))
    except pyvisa.errors.VisaIOError as exc:
        print(f"attempt {attempt}: {exc.abbreviation}")
rm.close()$ python retry.py
attempt 1: VI_ERROR_TMO
attempt 2: GALOIS,SIM-DMM,SIM00001,edgesim-100:00:08.786 sim-dmm-1 FAULT timeout count=1
00:00:10.259 sim-dmm-1 *IDN? timeout
00:00:11.267 sim-dmm-1 *IDN? → GALOIS,SIM-DMM,SIM00001,edgesim-1The same faults can be injected from pytest, against the same World, to test protection trips and the SCPI error queue.
How do I run a script beside the console?
By default the console serves every instrument on a loopback SCPI socket, in node order from port 5025. SIM-PSU-2 is the second node, so it listens on 5026, and @py is PyVISA's pure-Python backend, the pyvisa-py package. The console reads the World through the server's own call path, so a client and the UI never touch it at once.
import pyvisa

rm = pyvisa.ResourceManager("@py")
psu = rm.open_resource("TCPIP0::127.0.0.1::5026::SOCKET", read_termination="\n", write_termination="\n")

print(psu.query("*IDN?"))
psu.write(":SOURce1:VOLTage 12")
psu.write(":OUTPut1:STATe ON")
print("opc", psu.query("*OPC?"))
print("measured", psu.query(":MEASure1:VOLTage?"))
rm.close()$ python beside.py
GALOIS,SIM-PSU-2,SIM00001,edgesim-1
opc 1
measured +1.200017E+01The console, captured while the script ran (headers and rows trimmed):
edgesim — twelve-instruments | bench | 127.0.0.1:5025–5036           scaled t = 5.281 s
# ... elided
┌─ SIM-PSU-2 · POWER SUPPLY ──────────┐
│ ID:     GALOIS,SIM-PSU-2,SIM00001   │
│ CH1 CV  ON  12.000 V  0.0000 A      │
# ... elided
00:00:03.741  sim-psu-2      *IDN?  → GALOIS,SIM-PSU-2,SIM00001,edgesim-1
00:00:03.743  sim-psu-2      :SOURce1:VOLTage 12
00:00:03.789  sim-psu-2      :OUTPut1:STATe ON
00:00:03.790  sim-psu-2      *OPC?  → 1
00:00:03.798  sim-psu-2      :MEASure1:VOLTage?  → +1.200017E+01
The card shows the new setpoint, and the log shows every command in the order the World ran it, virtual time at the left. SCPI automation with Python covers the client side.
How do I attach the console to a World that pytest and galois-edge share?
The console's sockets carry SCPI, one command at a time, which cannot say "break this meter" or "advance the clock". A served World carries the whole World API (state reads, faults, clock steps, nets and the trace) to every client that attaches. The recommended setup, and the one for heavy benches such as a swept chain, is edgesim world serve --scpi in one terminal and edgesim tui --attach in another: the World and its SCPI listeners share a process, so the World's settles stay out of the console's frames.
$ edgesim world serve --socket "$PWD/w.sock" psu_resistor_dmm.bench.json --scpi --clock stepped --trace-dir trace
{"socket": "/.../w.sock", "bench_id": "psu-resistor-dmm", "scpi": {...}} # path and address map elided$ edgesim tui --attach "$PWD/w.sock"The server prints one JSON line once it listens (with --scpi, the SCPI address map too) and serves until SIGINT or SIGTERM. The attached console runs the served World's clock: this one is stepped, so a moves it, and --clock scaled makes scope screens stream. --attach takes a socket and no BENCH, opens no SCPI listeners, accepts --fps and no other in-process option, and on quit closes only its own connection, so the World keeps serving. Serving and attaching need Unix-domain sockets (Linux and macOS).
On EdgeSim's PSU, 1 kΩ resistor and DMM example bench, a Python client attaches with edgesim.remote.connect:
import sys

from edgesim.remote import connect

world = connect(sys.argv[1])
print(sorted(world.instruments()))
world.scpi("sim-psu-1", ":SOURce1:VOLTage 5;:OUTPut1:STATe ON")
world.advance(0.5)
print(world.scpi("sim-dmm-1", ":READ?"))
print(world.now_ns())
world.close()$ python attach.py "$PWD/w.sock"
['sim-dmm-1', 'sim-psu-1']
b'+5.000000E+00\n'
500000000The console in terminal 2 moved while the script ran:
┌─ SIM-PSU-1 · POWER SUPPLY ──────────┐ ┌─ SIM-DMM-1 · DMM ───────────────────┐
│ ID:     GALOIS,SIM-PSU-2,SIM00001   │ │ ID:     GALOIS,SIM-DMM,SIM00001     │
│ CH1 CV  ON  5.000 V  0.0050 A       │ │ VALUE 5.00000 V  READ               │
│ CH2 OFF  OFF  0.000 V  0.0000 A     │ │ RANGE 10.00 V  NPLC 10              │
│ WIRING: OUT1→vbus OUT2→—            │ │ WIRING: INPUT→vbus                  │
│ ERRORS: 0                           │ │ ERRORS: 0                           │
└─────────────────────────────────────┘ └─────────────────────────────────────┘
# ... elided
00:00:00.000  sim-psu-1      :SOURce1:VOLTage 5
00:00:00.000  sim-psu-1      :OUTPut1:STATe ON
00:00:00.500  *              ADVANCE 0.5 s
00:00:00.500  sim-dmm-1      :READ?  → +5.000000E+00
Now press 1 and Space in the console: the supply's outputs switch off and the log gains CONFIGURE output.enabled[1] = False, output.enabled[2] = False. The keypress is a World action, so it reaches the trace. This script prints a line per transition of the file the server wrote:
import json
import sys

for line in open(sys.argv[1]):
    record = json.loads(line)
    if record["kind"] != "transition":
        continue
    action = record["action"]
    what = action.get("raw") or action["kind"]
    if action["kind"] == "advance":
        what = f'advance {action["dt_ns"] / 1e9:g} s'
print(f'{record["seq"]:>2} t={record["t_virtual_ns"] / 1e9:5.3f} {record["instrument_id"] or "-":<10} {what}')$ python trace_summary.py trace/run-*.jsonl
0 t=0.000 sim-psu-1 :SOURce1:VOLTage 5
1 t=0.000 sim-psu-1 :OUTPut1:STATe ON
2 t=0.500 - advance 0.5 s
3 t=0.500 sim-dmm-1 :READ?
4 t=0.500 sim-psu-1 configureRecords 0 to 3 are attach.py; record 4 is the console's Space key. The trace does not label the client. It records what happened to the bench.
 attach.py             ──┐
 pytest test           ──┤
 galois-edge           ──┼── Unix socket ──▶ edgesim world serve ──▶ World ──▶ edgesim.trace/1
 edgesim tui --attach  ──┘
pytest and galois-edge attach to the same socket, with edgesim.remote.connect(PATH) in a fixture and SIM_MODE=true plus SIM_REMOTE_SOCKET=PATH for the daemon.
Pick the clock to match the work. scaled (the default, at real time) and wall let time pass while people or agents work and refuse a; --clock stepped moves time only when a client or the a key advances it, which suits tests that own time.
How do I capture reproducible screenshots?
--screenshot DIR runs the console headless on a stepped clock with no SCPI server, executes a script and saves one SVG for each @shot. A script is edgesim run syntax, <instrument_id> <SCPI> lines, @advance <seconds> and # comments, plus five UI directives: @shot NAME saves the screen as DIR/NAME.svg, @open ID opens an instrument screen, @home returns to the overview, @reveal state PATH or @reveal command PATH expands a tree to PATH and selects it, and @press KEY ... presses keys by Textual key names.
With no @shot at all, the default set is saved: overview, instrument-<id> for each instrument, nets and log. This script makes every picture a quickstart page needs:
# docs.script: every picture the guide needs
@shot overview
@open sim-psu-4
@shot psu-ovp-trip
@home
sim-psu-2 :SOURce1:VOLTage 12;:OUTPut1:STATe ON
@advance 0.5
@open sim-psu-2
@shot psu-12v-on
@press t
@reveal state output.protection.ovp_level
@shot psu-ovp-tree
@home
@press l
@shot log$ edgesim tui twelve_instruments.bench.yaml --screenshot shots --script docs.script
shots/overview.svg
shots/psu-ovp-trip.svg
shots/psu-12v-on.svg
shots/psu-ovp-tree.svg
shots/log.svg
$ edgesim tui twelve_instruments.bench.yaml --screenshot again --script docs.script > /dev/null
$ diff <(cd shots && sha256sum *.svg) <(cd again && sha256sum *.svg) && echo identical
identicalThe stepped clock, the seeded noise and the absent server make the pictures a function of the bench and the script, so a CI job regenerates them and a diff shows when a profile change moved a card. --size COLSxROWS sets the terminal (default 120 by 40), and --script - reads stdin.
An unknown instrument exits 2 before anything runs. A write the instrument refuses is reported on stderr as edgesim tui: line 1: sim-psu-1: error: -222,"Data out of range", and the shot is still saved with exit 0, because a refused write is often the point of the picture.
An SVG shows one instant, a picture and never a test result. The trace is the record.
How does the console draw an instrument it has never seen?
A thermal chamber has no template, so the console draws its card from the state: block of this illustrative profile; the commands: block declares the two commands the script below sends, and running carries is_dangerous: true:
schema_version: 2
instrument: {manufacturer: Acme, model: TC-100, class: thermal_chamber}
identity: {query: "*IDN?", patterns: ["ACME,TC-100,.*"]}

state:
  zone:
    setpoint:  {type: float, unit: degC, initial: 25.0, min: -40.0, max: 150.0}
    ramp_rate: {type: float, unit: degC/min, initial: 5.0, min: 0.1, max: 20.0}
    running:   {type: bool, initial: false}
    program:   {type: enum, options: ["HOLD", "RAMP"], initial: "HOLD"}

commands:
  zone:
    setpoint:
      type: property
      getter: ":ZONE:SETPoint?"
      setter: ":ZONE:SETPoint {temperature}"
      params: {temperature: {type: float, unit: degC, min: -40.0, max: 150.0}}
      returns: {type: float, unit: degC}
      writes: [zone.setpoint]
      reads: [zone.setpoint]
    running:
      type: property
      getter: ":ZONE:RUN?"
      setter: ":ZONE:RUN {state}"
      is_dangerous: true
      params: {state: {type: bool}}
      returns: {type: bool}
      writes: [zone.running]
      reads: [zone.running]

sim:
  idn: "ACME,TC-100,SIM00001,edgesim-1"
A one-node bench file places it, and ext.sim.profile names the profile:
version: 1
ext: {sim: {name: chamber, seed: 1, clock: {mode: stepped}}}
nodes:
  - id: inst-chamber
    kind: instrument
    label: chamber
    position: {x: 0, y: 0}
    instrumentId: chamber-1
    instrumentModel: TC-100
    functionRole: chamber
    ext: {sim: {profile: acme_tc-100}}
edges: []
Validate the bench, then capture the overview card after setting the setpoint over SCPI:
chamber-1 :ZONE:SETPoint 100
@shot chamber-card$ edgesim validate chamber.bench.yaml --profile-dir profiles; echo "exit=$?"
exit=0
$ edgesim tui chamber.bench.yaml --profile-dir profiles --screenshot shots --script chamber.script --size 100x30
shots/chamber-card.svg┌─ CHAMBER-1 · THER CHAM ──────┐
│ ID: ACME,TC-100,SIM00001 │
│ SETPOINT: 100.00 degC │
│ RAMP RATE: 5.000 degC/min │
│ RUNNING: OFF │
│ PROGRAM: HOLD │
│ WIRING: no ports │
│ ERRORS: 0 │
└──────────────────────────────┘An optional sim.display block in the profile trims and restyles the card. This excerpt replaces the profile's sim: block:
sim:
  idn: "ACME,TC-100,SIM00001,edgesim-1"
  display:
    summary: [zone.setpoint, zone.running]
    hidden: [zone.ramp_rate]
    widgets:
      zone.running: led
      zone.setpoint: gauge
summary picks the rows and sets their order. hidden removes a variable from cards and the default tree, and search still finds it. widgets restyles a row as a gauge (which needs min and max), sparkline, waveform, led or text. After the edit, the same command draws this:
┌─ CHAMBER-1 · THER CHAM ──────┐
│ ID:     ACME,TC-100,SIM00001 │
│ SETPOINT:  ████░ 100.00 degC │
│ RUNNING:   OFF               │
│ WIRING: no ports             │
│ ERRORS: 0                    │
└──────────────────────────────┘
Display hints are invisible to agents, and the console does not refuse a typo in one: with zone.runing in summary, edgesim validate exits 0 and the card draws zone.runing = —. galois-profiles lint catches it, so run it on profiles in CI:
$ galois-profiles lint profiles/acme_tc-100.yaml; echo "exit=$?"
profiles/acme_tc-100.yaml:/sim/display/summary/1: E-DISPLAY-PATH display.summary entry 'zone.runing' must name a state variable
profiles/acme_tc-100.yaml:/sim/display/summary/1: E-STATE-UNKNOWN display.summary entry 'zone.runing' names no state
exit=1
The console honors is_dangerous: Space on the chamber's card opens Switch ON chamber-1 RUNNING? with y and n, and sends nothing until you answer.
How do I watch Évariste work the same bench?
Galois is agent-driven test engineering for hardware teams: agents generate tests and instrument drivers, run them on real benches through the open-source galois-edge daemon, and turn the results into reports and a shared engineering record.
With SIM_REMOTE_SOCKET set, the shared World is one more bench to that platform: Évariste, the agent in the Galois platform, and any MCP client work it with the tools they use on a real one. Serve the twelve-instrument bench with --clock wall, attach the console, start galois-edge with SIM_MODE=true and SIM_REMOTE_SOCKET set to the socket (the keys are in the configuration reference), and open Évariste from the app sidebar (Ctrl+Shift+E) beside a project whose topology is that bench.
Make the first task read-only, so the console's job is showing what was sent. State the task with its limits:
On the twelve-instrument bench, check that supply 1 reads its 5 V setpoint within 2%, and report whether supply 4 shows a protection trip. Read only: never write a setpoint, switch an output or clear a trip.
Évariste drafts a sequence of named profile commands, with the limit on the measurement (2% of 5 V is 0.1 V):
steps:
  - name: "PSU 1 reads its setpoint"
    type: numeric_limit
    config:
      instrument_id: "sim-psu-1"
      command_name: "measure.voltage"
      low_limit: 4.9
      high_limit: 5.1
      unit: "V"
      comparison: "GELE"

  - name: "PSU 4 trip state"
    type: action
    config:
      instrument_id: "sim-psu-4"
      command_name: "output.protection.tripped"
Review and approve. The draft cannot run until you approve it. Check the instrument ids, the 4.9 V and 5.1 V limits against the 2% you asked for, and that no step writes; how to review an AI-generated test plan lists the rest. Every requested change becomes a new version with a diff.
Run it and watch. Start the run and galois-edge executes it on the shared World. The cards stay put (supply 1 at CH1 CV ON 5.000 V, supply 4 on OVP with ERRORS: 1 324) because neither read touches state or the error queue; the console adds the SCPI LOG, the instrument-side record of what the agent sent, to set beside the approved steps. These lines come from sending the same two queries from a script, so the readings are the bench's and not an agent's:
00:00:00.000  sim-psu-1      :MEASure1:VOLTage?  → +5.000890E+00
00:00:00.000  sim-psu-4      :OUTPut1:PROTection:TRIPped?  → 1
Two approved steps, two queries: the log matches. A :SOURce or :OUTPut1:STATe write, or a CONFIGURE line, that no approved step explains is a finding, because the agent or the draft strayed outside your limits. Here the first reading passes (5.00089 V against 4.9 V to 5.1 V) and supply 4 answers 1, tripped. Ask Évariste what the run found, then "Generate a test report from the last run".
Watching is not approval. The console is a window, not a gate: a moving card approves nothing and a steady one is not a pass. The run record is the evidence: each step's measured value, limits, verdict, raw command and response, instrument and timestamps, with the transition traces beside it (TRACE_DIR on the daemon, --trace-dir on the World). A pass here rehearses the sequence against a model and says nothing about your hardware.
The sequence rehearsal gate is in build: every sequence will dry-run on a virtual bench built from the project topology before approval. Today you run that rehearsal yourself on a World like this one, and the console lets you watch it.
You no longer write the glue that drives the World, the step list or the report. The objective, the limits, the review and approval, and the decision to stop the run stay yours. AI test automation for hardware benches covers the wider loop.
| Step | Code path (this guide) | Galois with Évariste |
|---|---|---|
| See the bench | edgesim tui BENCH or --attach | The same console beside the sidebar, on the World galois-edge uses |
| Audit what was sent | The SCPI LOG against your script | The SCPI LOG against the approved steps |
| Break it | f on a card | f on a card; MCP sim_inject_fault when SIM_CONTROL_TOOLS is on |
| Record | --trace-dir trace | Per-step run record plus the TRACE_DIR trace |
| Report | Your script over the trace | "Generate a test report from the last run" |
When is plain code enough?
If nobody watches, the console adds a screen and no coverage. CI belongs to pytest with the edgesim_world fixture and edgesim run, and a screenshot is not an assertion. If one script owns one instrument, a PyVISA script against sockets is the whole job. The console earns its place when you want to see the bench rather than assert on it: to find the tripped supply, break a meter while a client retries, check what an agent sent or regenerate a docs page's pictures.
A served World is a Unix socket on one machine; to share a bench across machines, serve one World per machine from the shared bench file. The open-source EdgeSim announcement covers what ships and where the project goes, the Galois product overview shows what agents do with a described bench, and Simulate an oscilloscope in Python is next: the generator, RC filter and scope bench from this console, read as a decoded waveform block.
Frequently asked questions
- How do I open a terminal console for a simulated instrument bench?
- EdgeSim's open-source release, with its edgesim[tui] console extra, is coming soon; then run edgesim tui bench.yaml. The console draws one card per instrument from its profile, with the nets between them, a live SCPI log and keys for edits and faults. The clock runs at real time by default, so scopes stream and the header counts; --clock stepped gives a clock that moves only when you advance it. It also opens one SCPI socket per instrument from port 5025, so a script can drive the same bench you are watching.
- How do I share one simulated bench between pytest, a console and an agent?
- Run edgesim world serve --socket PATH bench.yaml --scpi, which serves one World on a Unix-domain socket and its instruments on SCPI sockets. Attach the console with edgesim tui --attach PATH, connect Python clients with edgesim.remote.connect(PATH), and point galois-edge at it with SIM_MODE=true and SIM_REMOTE_SOCKET=PATH. Every client acts on the same World, and one trace records all of it.
- Can I take reproducible screenshots of the EdgeSim terminal UI for documentation?
- Yes. edgesim tui bench.yaml --screenshot DIR --script FILE runs headless on a stepped clock with no sockets, executes SCPI lines, @advance, @open, @press and @reveal directives, and saves one SVG for each @shot line. The same bench and script give byte-identical files, so a CI job can regenerate every documentation image.
- Does the console work with an instrument EdgeSim has no template for?
- Yes. Nine class templates cover supplies, multimeters, scopes, function generators, electronic loads, spectrum analyzers, RF generators, lock-ins and source-measure units. Any other profile gets a generic layout built from its typed state, ports and acquisition commands. An optional sim.display block in the profile picks which readouts show and restyles them as gauges, sparklines or LEDs.
- Can I watch an AI agent work a virtual bench?
- Yes. Serve the bench with edgesim world serve, attach the console, and start galois-edge with SIM_REMOTE_SOCKET pointing at the same socket. An agent such as Évariste, the agent in the Galois platform, then drives the bench through the same tools it uses on real instruments, and the SCPI log records every command it sends while the cards show what changed. Watching is not approval: the run record, not the screen, is the evidence.
Bring Galois to your bench.
The daemon is Apache-2.0, free forever. Enterprise runs in your cloud or on-prem.